


ATTENTION, PHASE 3 WATER SHORTAGE declared by Southwest Florida Water Management District. Learn more.


How has the ‘road diet’ impacted travel times
on S. Florida Ave (SR 37)?
There’s no way around it: Narrowing a busy road like S. Florida Avenue from 5 lanes to 3 lanes is going to slow things down a bit — but maybe not as much as you think. Several things were done to keep traffic flowing in the one-mile “road diet” corridor from Ariana St. to Lime St.:
- Wider travel lanes: The old non-compliant lanes were only 8.5 feet wide – the same width as a standard tractor-trailer. During realignment, they were widened to the state standard of 11 feet.
- Relocated bus stops: Transit stops were moved out of the study area so buses wouldn’t hold up traffic. (The new Peach Line established by Citrus Connection uses adjacent roads.)
- Longer green lights: Traffic light times were lengthened.
After more than 18 months of collecting data from 90+ sensors and numerous cameras, the results are in and the delays aren’t as significant as many feared:
- The average driving speed through the Dixieland corridor has decreased from 33 mph to 30 mph (the posted speed limit).
- Average travel time during the morning rush hour is virtually unchanged.
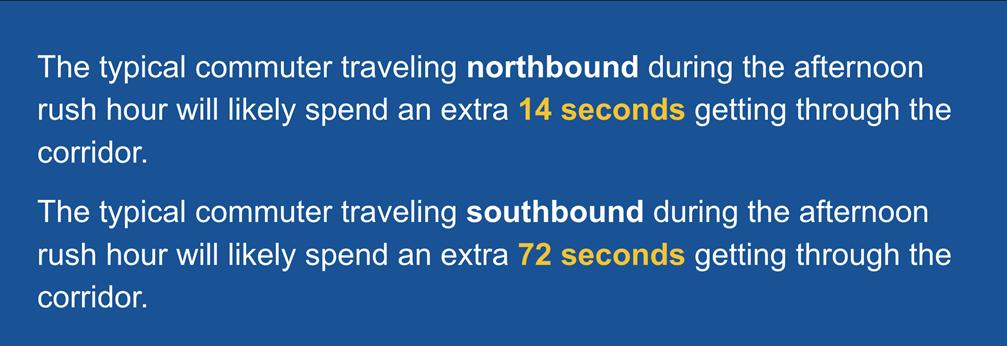
- Average travel time during the afternoon rush hour has increased, but only by 14 seconds northbound and 72 seconds southbound.
Here is a more detailed breakdown of the data:
AVERAGE TRAVEL TIMES BEFORE THE ROAD DIET
(Monday-Friday, 4:45 p.m.-5:45 p.m.)
|
FEB 2020* Average weekday PM peak travel time |
|
| Northbound | Southbound |
| 3 minutes, 17 seconds | 3 minutes, 4 seconds |
*One month before pandemic shutdowns began and two months before installation of the concrete islands started.
Fast forward two years, and this is the most recent data for S. Florida Avenue.
AVERAGE TRAVEL TIMES AFTER THE ROAD DIET
(Monday-Friday, 4:45 p.m.-5:45 p.m.)
|
FEB 2022 Average weekday PM peak travel time |
|
| Northbound | Southbound |
| 3 minutes, 34 seconds | 4 minutes, 31 seconds |
|
MAR 2022 Average weekday PM peak travel time |
|
| Northbound | Southbound |
| 3 minutes, 29 seconds | 4 minutes, 23 seconds |
|
APR 2022 Average weekday PM peak travel time |
|
| Northbound | Southbound |
| 3 minutes, 31 seconds | 4 minutes, 16 seconds |
THREE-MONTH AVERAGE
- Northbound: 3 minutes, 31 seconds (+14 seconds vs. before road diet)
- Southbound: 4 minutes, 23 seconds (+72 seconds vs. before road diet)

How do we know?
The one-mile section of S. Florida Avenue between Ariana St. and Lime St. has been monitored by more than 90 BlueTOAD sensors and dozens of cameras since before the pilot project began. Data has been collected by the City of Lakeland’s Traffic Management Center, the Florida Department of Transportation, and Traffic Engineering Data Solutions, Inc.
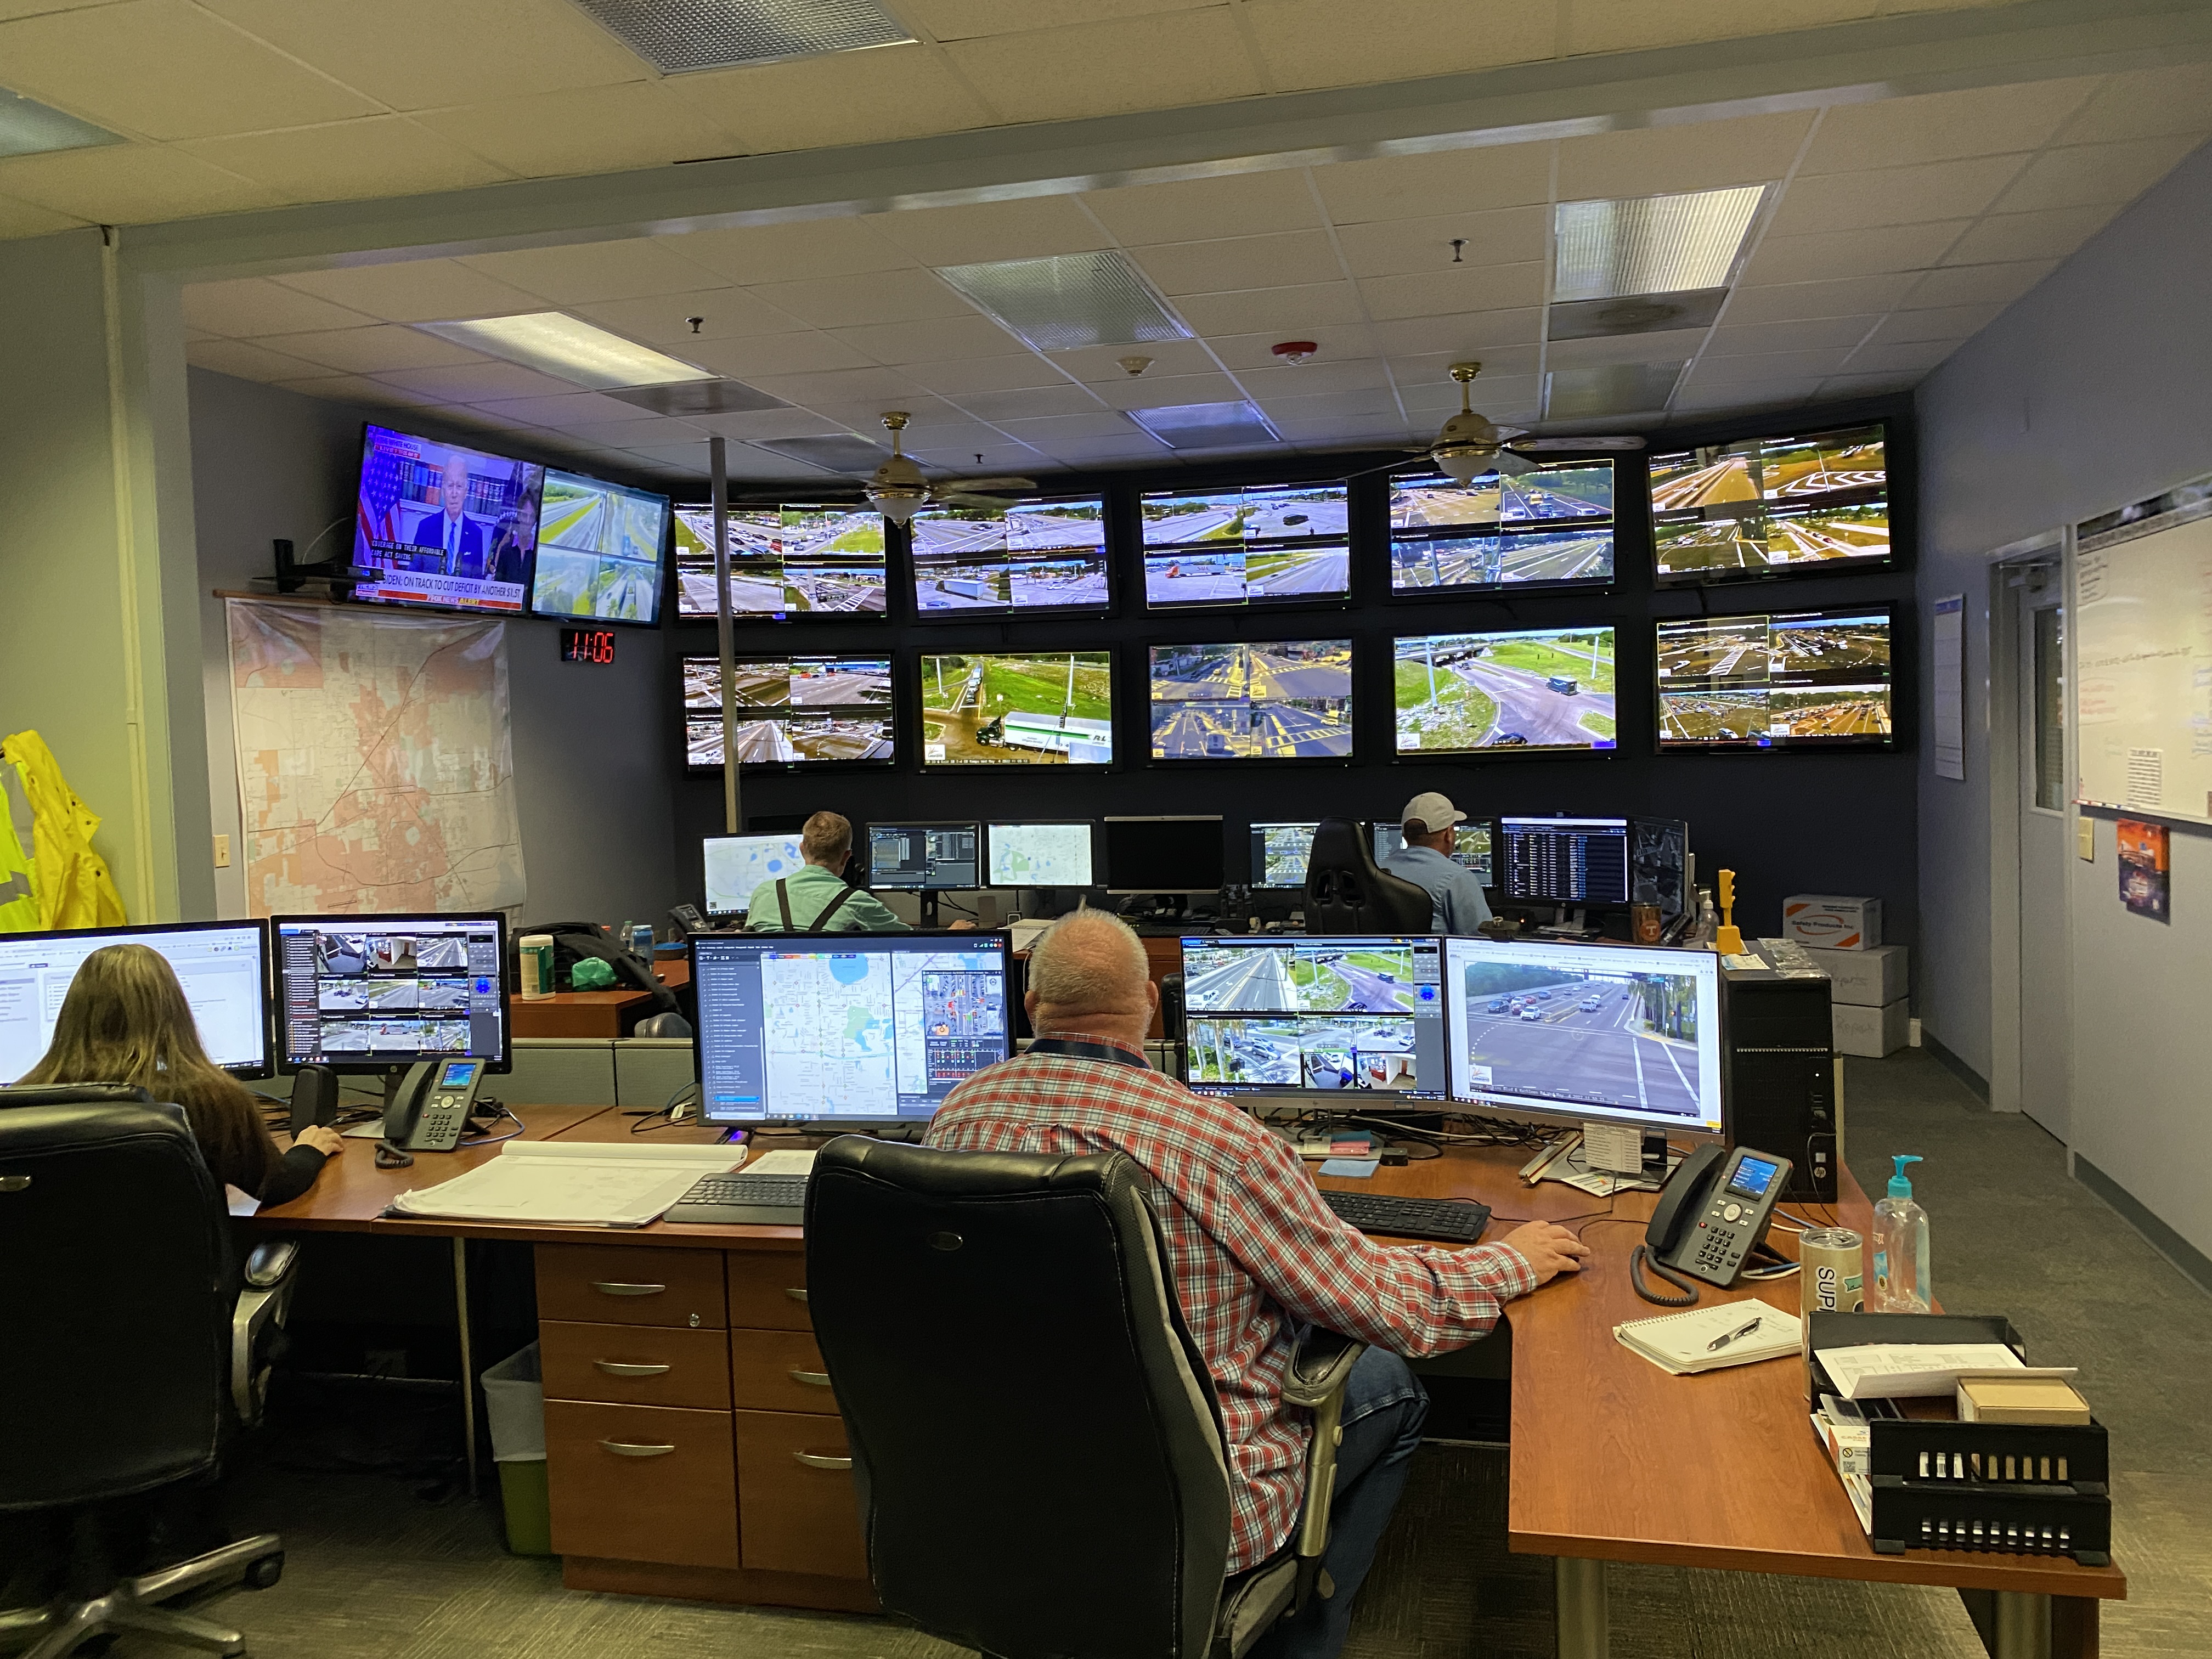
City of Lakeland Traffic Management Center
What about COVID?
The travel times above compare February 2020 – a month before COVID pandemic shutdowns began – and February to April 2022, with vaccinations widely available, case counts low, masking recommendations lifted, and most businesses and individuals settled into a “new normal.”
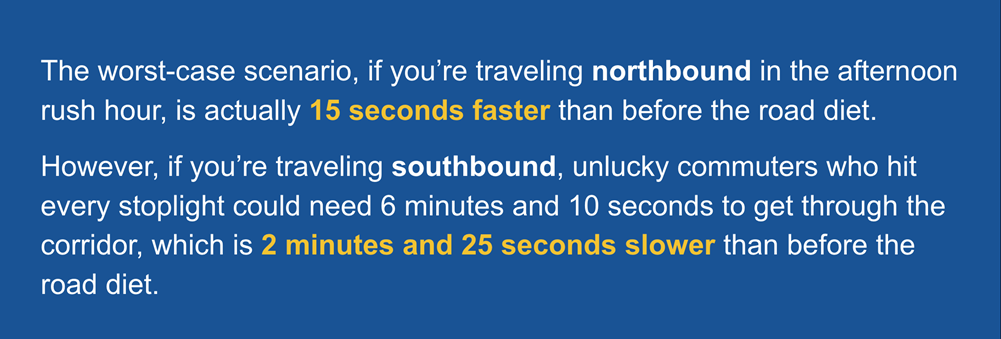
Averages don’t reveal the full range of experiences. What about the unlucky commuters at the highest end of the travel times?
In addition to average commute times, traffic system technicians have computed times in the 5th, 25th, 75th, and 95th percentile ranges.
LONGEST TRAVEL TIMES BEFORE THE ROAD DIET
(95th percentile)
|
FEB 2020 95th percentile of commuters, weekday PM peak |
|
| Northbound | Southbound |
| 4 minutes, 23 seconds | 3 minutes, 45 seconds |
LONGEST TRAVEL TIMES AFTER THE ROAD DIET
(95th percentile)
|
FEB 2022 95th percentile of commuters, weekday PM peak |
|
| Northbound | Southbound |
| 4 minutes, 6 seconds | 6 minutes, 14 seconds |
|
MAR 2022 95th percentile of commuters, weekday PM peak |
|
| Northbound | Southbound |
| 4 minutes, 3 seconds | 6 minutes, 25 seconds |
|
APR 2022 95th percentile of commuters, weekday PM peak |
|
| Northbound | Southbound |
| 4 minutes, 15 seconds | 5 minutes, 51 seconds |
THREE-MONTH AVERAGE OF LONGEST TRAVEL TIMES
- Northbound: 4 minutes, 8 seconds (-15 seconds vs. before road diet)
- Southbound: 6 minutes, 10 seconds (+145 seconds vs. before road diet)
How about the morning rush hour?
Travel times during the morning rush hour are virtually unchanged from February 2020. This may be because people are using alternate routes, but the northbound travel through the corridor is only taking 1 second longer and southbound travel is actually 4 seconds faster than before the road diet.
Here are the details:
AVERAGE TRAVEL TIMES BEFORE THE ROAD DIET
(Monday-Friday, 7:30 a.m. - 8:30 a.m.)
|
FEB 2020 Average weekday AM peak travel time |
|
| Northbound | Southbound |
| 3 minutes, 0 seconds | 2 minutes, 56 seconds |
Link: February 2020 AM Peak.jpg
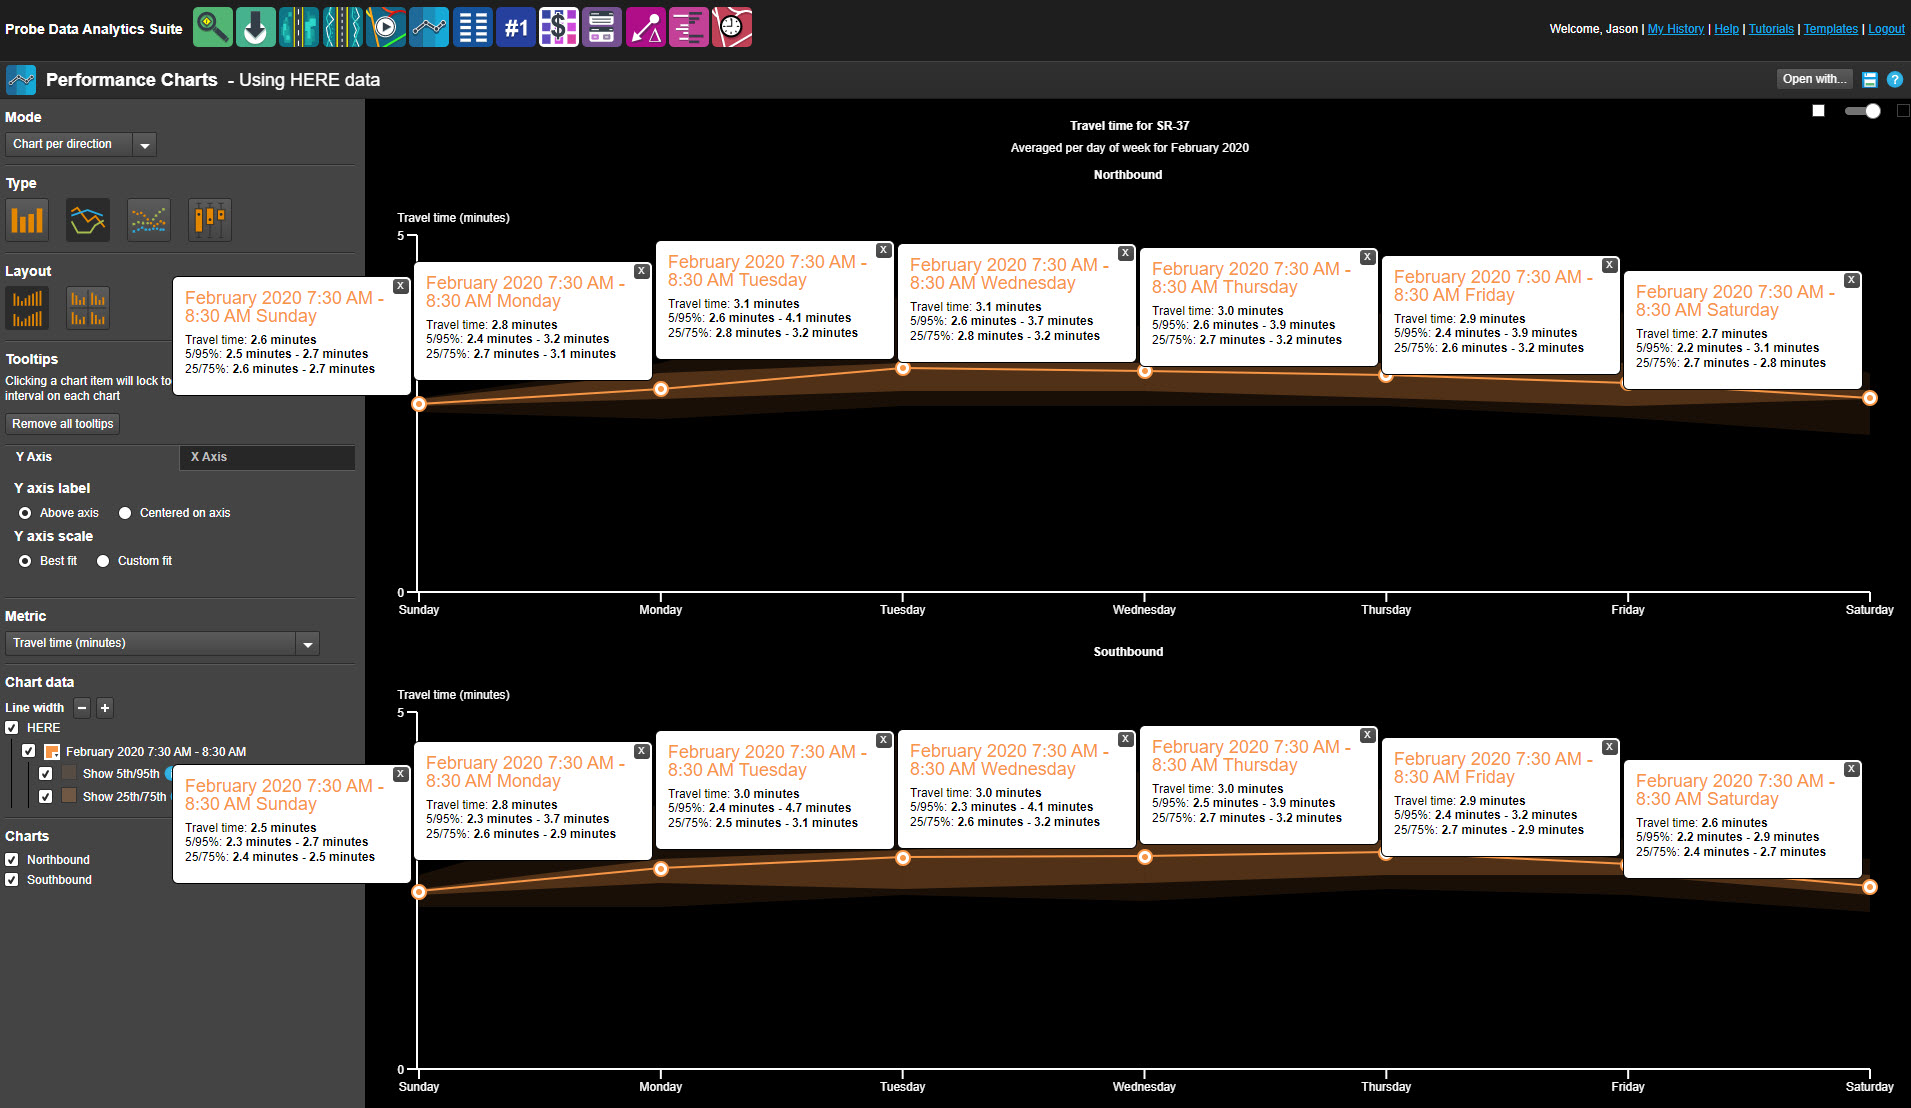
AVERAGE TRAVEL TIMES AFTER THE ROAD DIET
(Monday-Friday, 7:30 a.m. - 8:30 a.m.)
|
FEB 2022 Average weekday AM peak travel time |
|
| Northbound | Southbound |
| 2 minutes, 59 seconds | 2 minutes, 55 seconds |
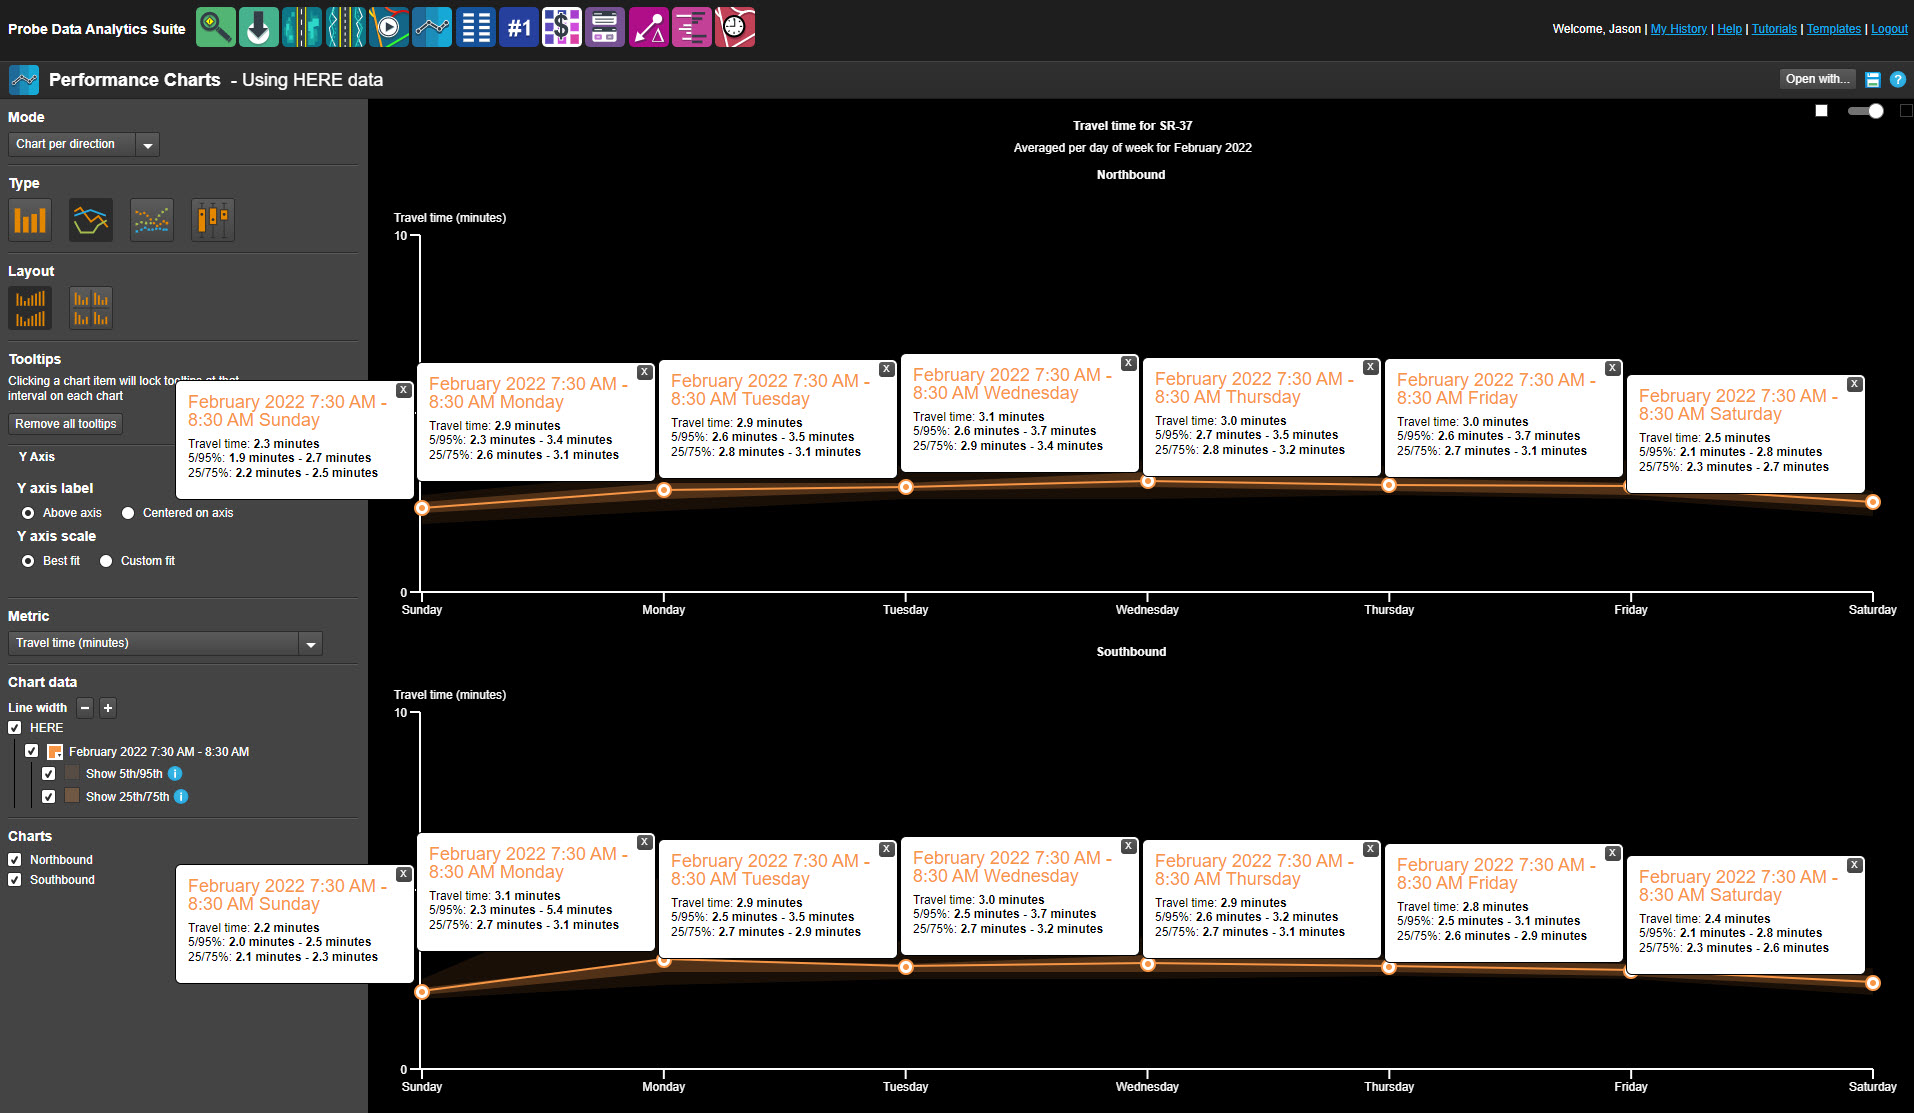
|
MAR 2022 Average weekday AM peak travel time |
|
| Northbound | Southbound |
| 2 minutes, 59 seconds | 2 minutes, 48 seconds |
Link: March 2022 AM Peak.jpg
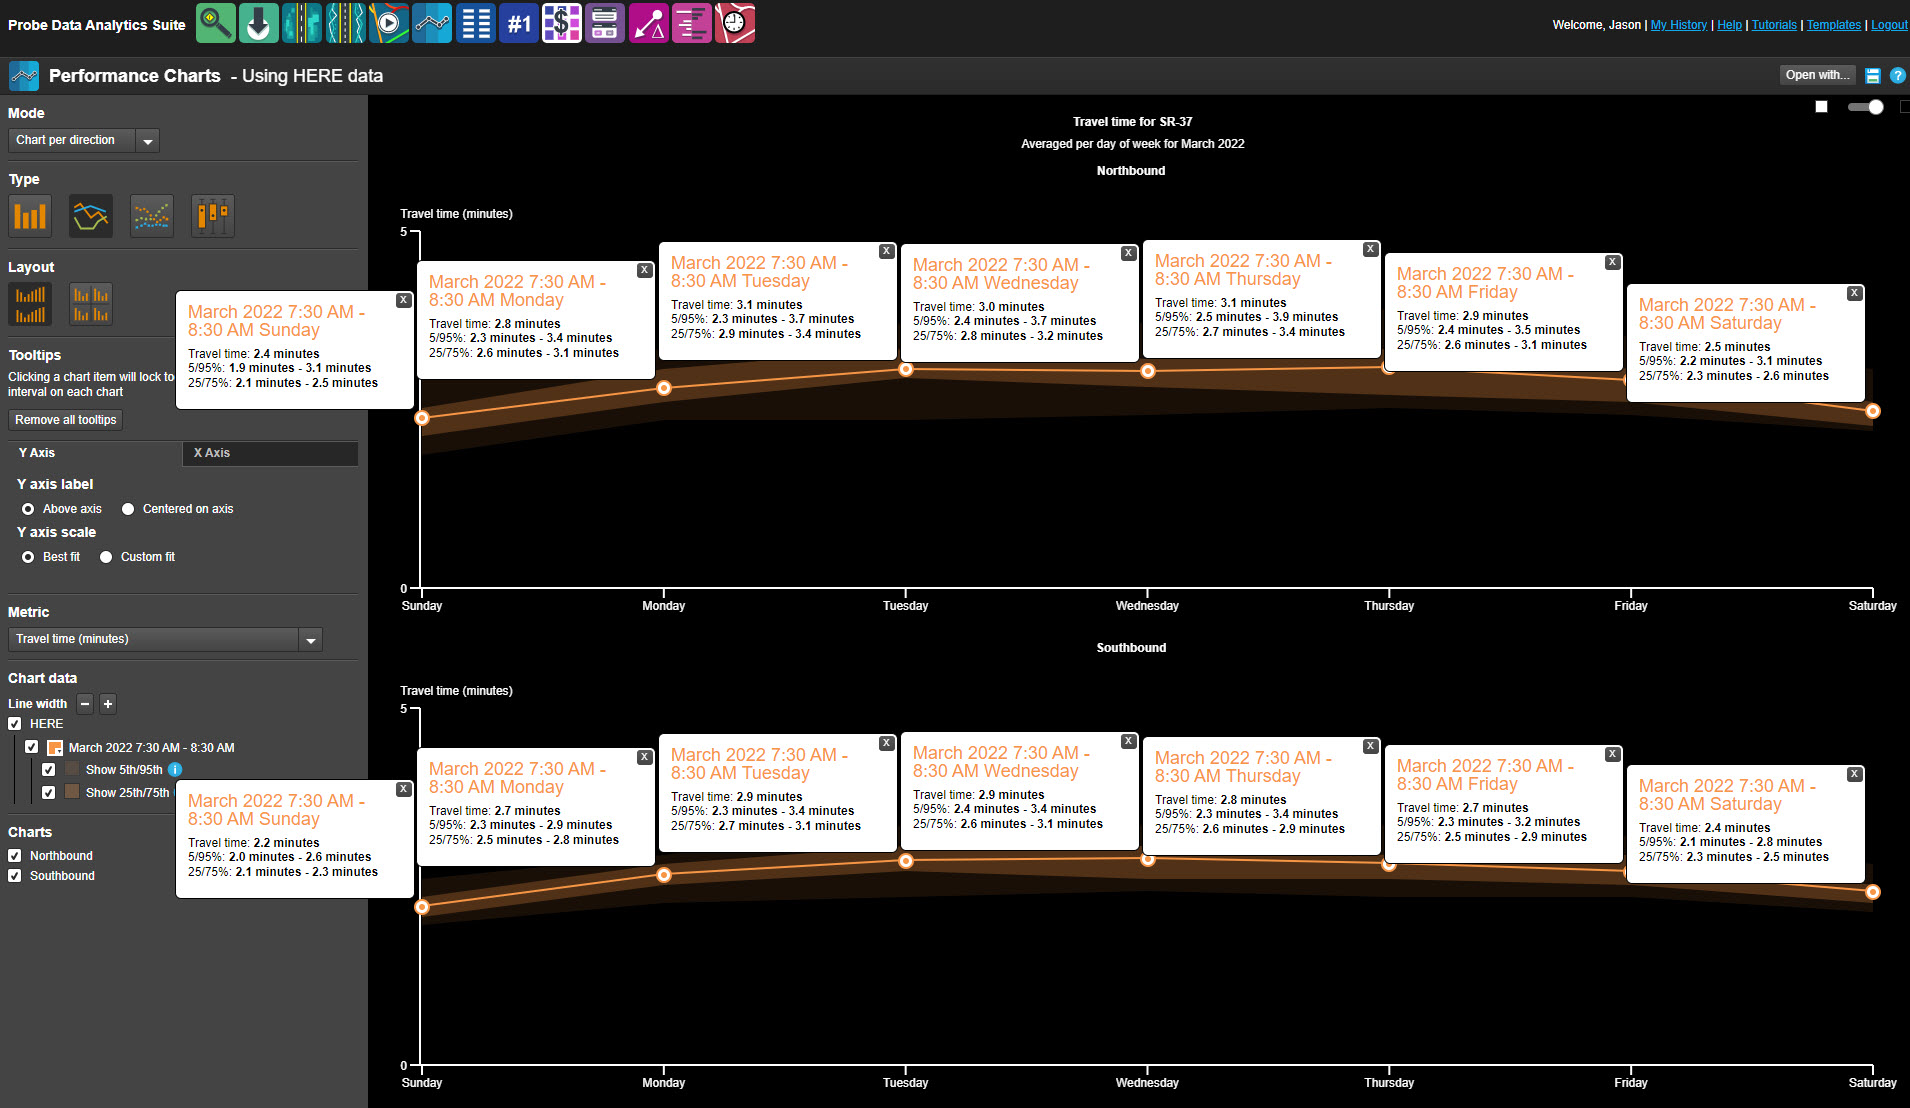
|
APR 2022 Average weekday PM peak travel time |
|
| Northbound | Southbound |
| 3 minutes, 6 seconds | 2 minutes, 53 seconds |
Link: April 2022 AM Peak.jpg
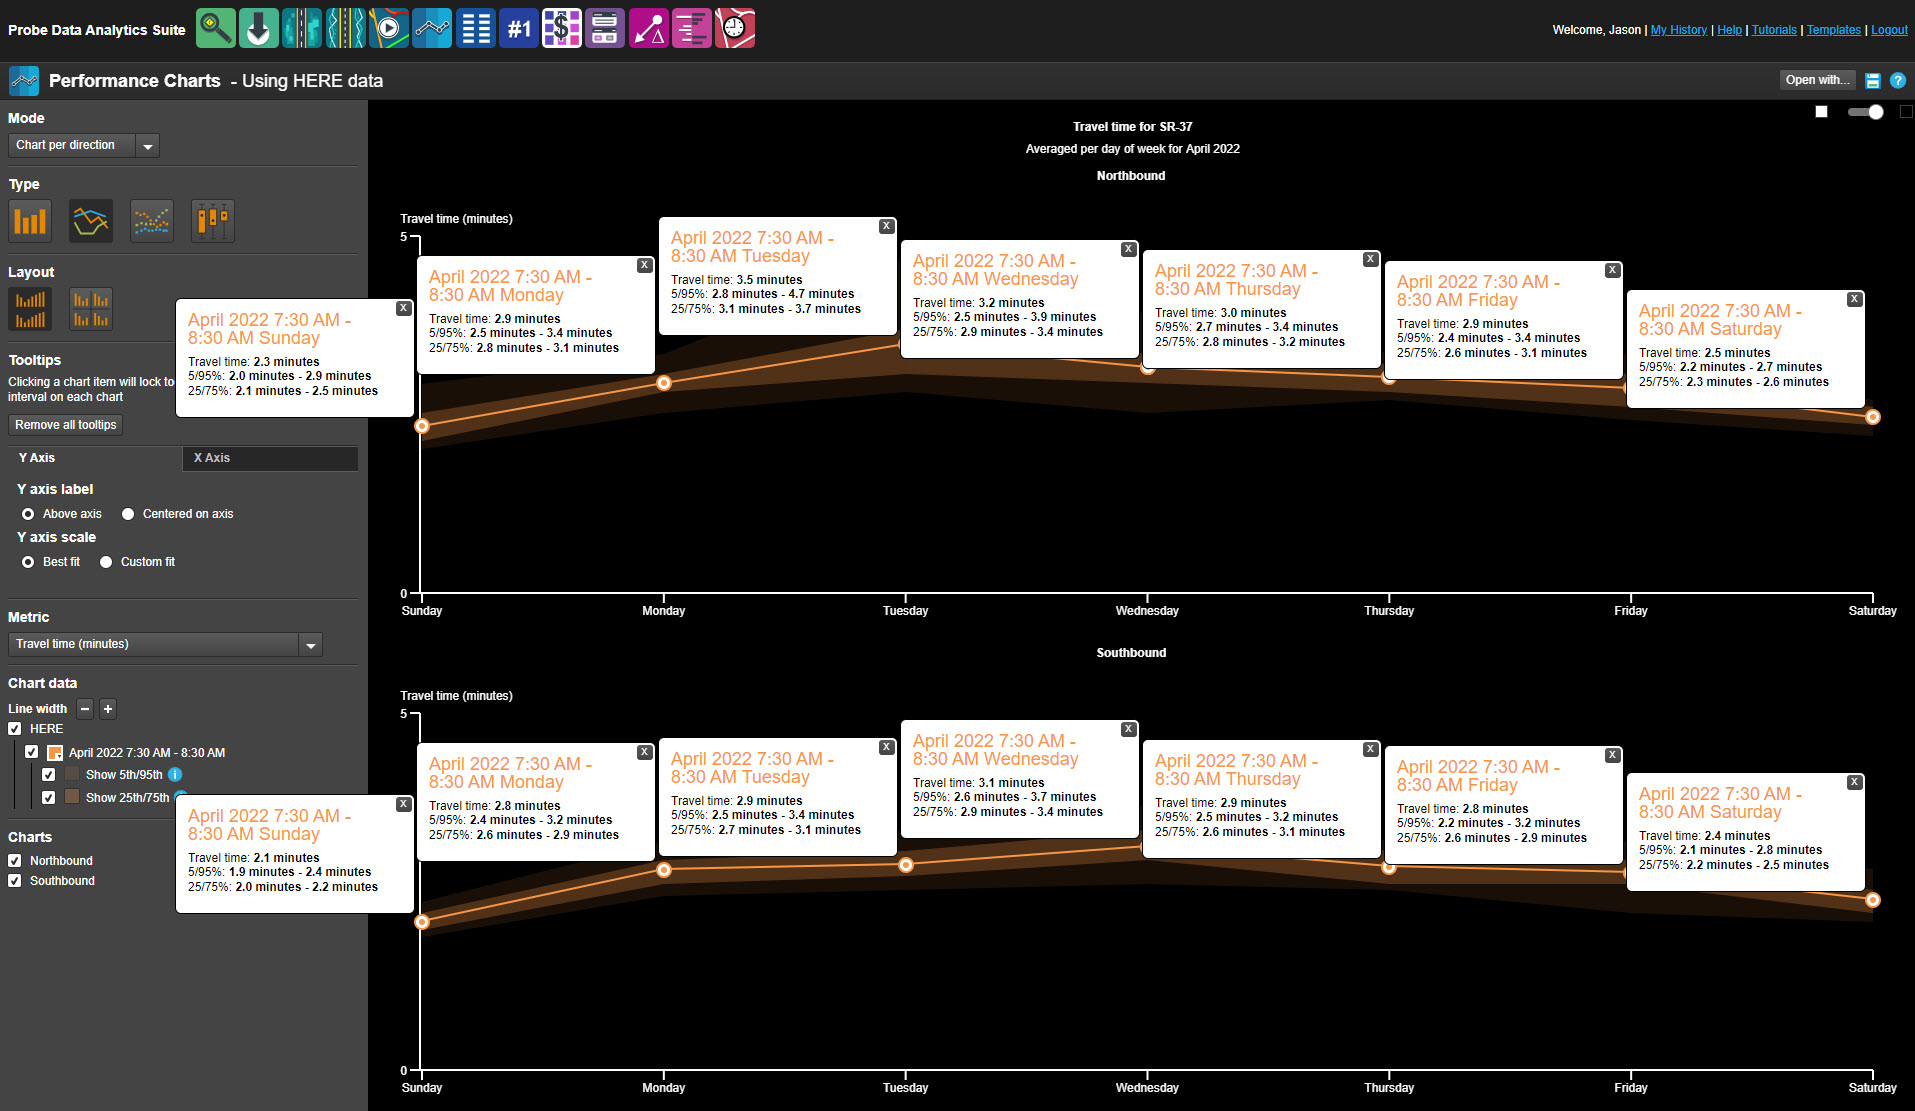
THREE-MONTH AVERAGE
- Northbound: 3 minutes, 1 second (+1 second vs. before road diet)
- Southbound: 2 minutes, 52 seconds (-4 seconds vs. before road diet)
SOURCE MATERIAL: City of Lakeland Traffic Management Center, May 2022